Objective testing questions involving the under or over absorption of overhead and fixed overhead volume variances commonly cause difficulties for FMA/MA candidates. This article looks at a graphical explanation of fixed overhead absorption
Under or over absorption
Consider a company with budgeted fixed production overheads of $10,000 for the coming year. Graph 1 represents the behaviour of this cost with respect to volume of output.

If budgeted output (activity) for the year was 1,000 units, the company could use a fixed production overhead absorption rate (FOAR) of:
Budgeted fixed production overhead = $10,000 = $10 per unit
Budgeted units 1,000
Graph 2 shows this FOAR being used to absorb overhead into production, in a situation where output and expenditure are as budgeted.

The graph shows that absorption costing takes what is a fixed cost ($10,000 per year), and converts it to a cost per unit of activity, effectively treating it as a variable cost ($10 per unit).
This approach will lead to the correct amount of overhead being absorbed, if
- Actual activity = budgeted activity, and
- Actual overhead = budgeted overhead.
However if either of these conditions are broken then under or over absorption of overhead can occur.
Graph 3 shows a situation where actual activity is greater than budgeted activity and actual overhead expenditure is as budgeted. This results in $12,000 of overhead being absorbed and consequent over absorption of overhead by $2,000.
| Absorbed overhead = Actual units x FOAR = 1,200 units x $10 per unit = | $12,000 | |
| Actual overhead = | $10,000 | |
| Over/(under)absorbed overhead | $2,000 |

Graph 4 shows a situation where both actual activity and actual overhead expenditure differ from budget.
In this case actual activity is greater than budgeted, leading to over absorption. At the same time actual overhead is lower than budgeted, also leading to over absorption. The total over absorption is $5,000.
| Absorbed overhead = Actual units x FOAR = 1,200 units x $10 per unit = | $12,000 | |
| Actual overhead = | $7,000 | |
| Over/(under)absorbed overhead | $5,000 |
The graph shows that of the $5,000 over absorption, $2,000 is due to increased activity ($12,000 absorbed being greater than $10,000 budgeted) and $3,000 being due to reduced expenditure (actual expenditure being $7,000 as compared to $10,000 budgeted.

FOAR based upon labour hours
So far the examples have used FOARs based upon units of output. In practice other measures of activity, in particular direct labour hours (DLHs), are used as an absorption base.
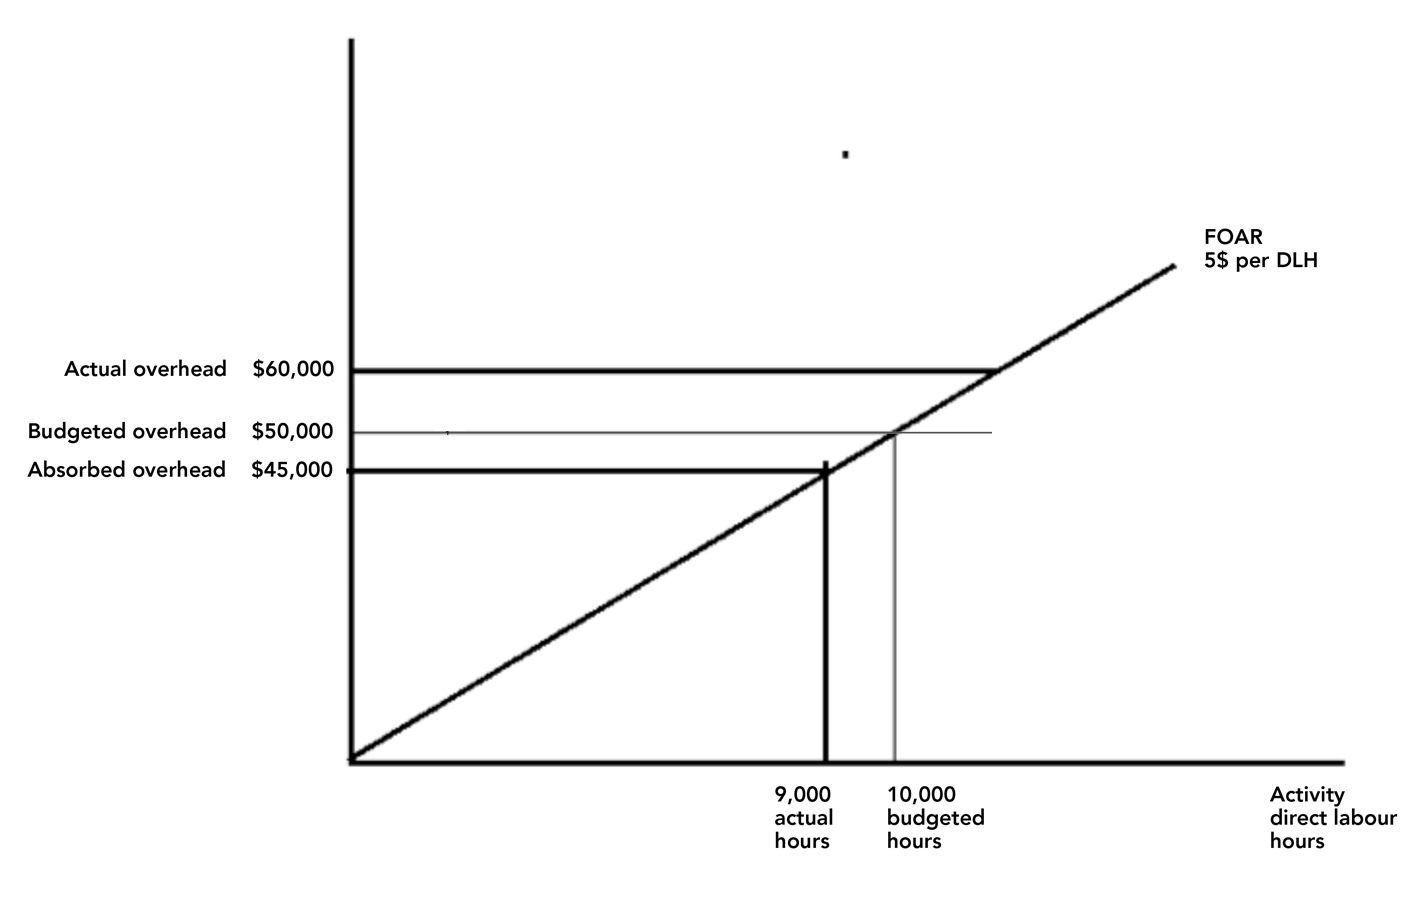
Assume a company budgeted to work 10,000 direct labour hours in the coming year. If budgeted fixed production overhead was $50,000 the FOAR would be:
Budgeted overhead Budgeted activity | $50,000 10,000 DLH | = $5 per hour |
If in the year actual overhead was $60,000 and actual direct labour hours were 9,000 the following under absorption would occur:
| Absorbed overhead = Actual hours x FOAR = 9,000 x $5 per unit = | $45,000 | |
| Actual overhead = | $60,000 | |
| Over/ (under)absorbed overhead | ($15,000) |
Graph 5 shows this situation

Graph 6 shows the general drivers of under or over absorption we have discussed so far.

Now try a question
The following question was identified as being badly answered in a previous F2 Examiner’s report.
A company uses absorption costing with a predetermined hourly fixed overhead absorption rate. Last year, the following situations arose:
Which of the following statements is correct?
|
(Hint: Use graph 6)
The correct answer is 4.
Answer 2 was the most popular of the wrong answers, which suggests that candidates understood that situation (1) leads to over absorption and that it was situation (2) that caused the problem. If actual hours worked are below budget then by applying the predetermined absorption rate (which is based on budgeted hours) to this lower number of actual hours will lead to under absorption.
Answers 1 and 3 were chosen by a significant number of candidates, indicating a general lack of understanding of the topic. Interestingly, when a calculation question is a set on this topic the performance is better.
Standard costing fixed overhead expenditure and volume variances
A similar approach may be used to understand standard costing fixed overhead variances. You simply need to remember that an over absorption of overhead is equivalent to a favourable variance (because it is added back to profit) and by similar logic an under absorption of overhead is equivalent to an adverse variance.
Assume that the standard fixed overhead absorption rate for a product is $10 per unit, based upon a budgeted output of 1,000 units, and budgeted fixed overhead expenditure of $10,000.
If everything goes according to budget then no variances will occur. This situation is shown in graph 7 where actual overhead expenditure is the same as budgeted and actual production is 1,000 units.

However if actual expenditure is $13,000 and 600 units are produced the following situation will arise (graph 8)

Actual activity being lower than budgeted causes an under absorption effect of $4,000. This is known as an adverse volume variance. Actual expenditure being higher than budgeted will also result in further under absorption of $3,000, making $7,000 in total. The standard cost variance calculation would look like this
| Actual overhead | $13,000 | |
| Fixed Overhead expenditure variance | >$3,000 adv | |
| Budgeted overhead | $10,000 | |
| Fixed Overhead volume variance | >$4,000 adv | |
| Actual units x standard FOAR 600 units x $10/unit | $6,000 |
Standard costing capacity volume efficiency and variances
In standard costing systems where overheads are absorbed on direct labour hours, companies sometimes analyse the fixed overhead volume variance into capacity and volume efficiency elements.
Assume a company budgeted to produce 1,000 units of product in 5,000 labour hours (each unit therefore taking 5 standard hours of labour). Budgeted fixed production overhead for the period was $10,000.
If overhead was absorbed on labour hours this would result in a standard fixed overhead cost of
Budgeted overhead $10,000 = $2.00 per direct labour hour
Budgeted activity 5,000 hrs
In the period 1,200 units were produced taking 5,400 labour hours.
For simplicity assume that there was no fixed overhead expenditure variance, that is that actual overhead expenditure was as budgeted.
Graph 9 shows the outcome of this situation

Because the company works at above budgeted capacity (5,400 labour hours as compared to 5,000 budgeted hours) a favourable variance (over absorption of overhead) of $800 is recorded. This is the capacity variance.
However, output in a standard costing system production will be costed at standard cost. This means that when production enters finished goods we will value it as if it was made at standard cost. This means that as far as fixed overheads go it will be assumed to have been made in 5 hours costing $2 per hour.
Thus our 1,200 units produced should have taken 6,000 hours (1.200 x 5 hours, and should have cost $12,000. (6,000 hours x $2 standard FOAR). Consequently a further favourable variance of $1,200 is recorded for efficiency reasons (the company was efficient because it produced 6,000 standard hours worth of product in 5,400 hours). This is known as the volume efficiency variance.
Together the capacity and volume efficiency variance sum to the fixed overhead volume variance.
In a standard costing variance calculation the calculation would look like this:
| Actual overhead | $10,000 | |
| Fixed Overhead expenditure variance | >$zero | |
| Budgeted overhead | $10,000 | |
| Fixed Overhead capacity variance | >$800 fav | |
| Actual hours x standard FOAR (5,400 hours x $2/hour | $10,800 | |
| Fixed Overhead volume efficiency variance | >$1,200 fav | |
| Standard hours for actual production (1,200 units x 5 hours x $2 per hour) | $12,000 |
Written by a member of the management accounting examining team