Relevant to ACCA Qualification Paper P4
The principal objective of financial management is to maximise shareholder wealth. This raises two key questions – how can we measure whether shareholder value is being created or destroyed, and which performance appraisal targets ensure that managers act in such a way as to generate shareholder value?
We therefore require a wealth metric for measuring shareholder value, and a performance metric to use for target setting. This article outlines the requirements for a system of metrics and then reviews some of the current contenders, including net present value (NPV), shareholder value analysis (SVA), economic value added (EVA), and cash flow return on investment (CFROI).
REQUIREMENTS
Traditional approaches to measuring managerial performance, such as profit and return on investment (ROI), have the significant disadvantage that they correlate poorly with shareholder value. As a result, managers could unwittingly destroy shareholder value while attempting to improve divisional performance. Attempts to develop more useful metrics have focused on incorporating three key issues:
- Cash is preferable to profit
Cash flows have a higher correlation with shareholder wealth than profits. - Exceeding the cost of capital
The return, however measured, must be sufficient to cover not just the cost of debt (for example by exceeding interest payments), but also the cost of equity. Peter Drucker commented, in a Harvard Business Review article: ‘Until a business returns a profit that is greater than its cost of capital, it operates at a loss. Never mind that it pays taxes as if it had a genuine profit. The enterprise still returns less to the economy than it devours in resources... until then it does not create wealth; it destroys it.’ - Managing both long and short-term perspectives
Investors are increasingly looking at long-term value. When valuing a company’s shares, the stock market places a value on the company’s future potential, not just its current profit levels.
Company announcements – about capital expenditure, research and development, or new investments – are often treated as positive rather than negative factors by the market, even though these announcements may have a detrimental effect on short-term profits. New biotechnology companies, for example, clearly have a value despite the fact that many currently have no products.
Managerial target setting and performance appraisals are usually focused on the shorter term. The danger is that managers may be pressured to improve performance in the short-term at the expense of longer-term value.
APPROACH 1: DISCOUNTED CASH FLOWS (DCF) AND NET PRESENT VALUE (NPV)
Most students will be familiar with the NPV approach to project appraisal. This method involves the following steps:
- Determine the relevant, incremental cash flows for the project.
- Discount the cash flows using an appropriate rate that reflects the risk of the project.
- Accept the project if the NPV>0.
The main advantage of this approach is the high correlation between NPV and shareholder value. Theoretically, undertaking a project with a positive NPV of, say, $1m will increase the market value of the company concerned (and hence shareholder wealth) by $1m. Given that the main objective of financial management is to maximise shareholder wealth, managers have, in NPV, a powerful technique for evaluating projects.
What is lacking, however, is an operating performance measure for managers that will help them to maximise NPV. Some firms attempt to use cash flow targets but with mixed success. Depressingly, many more firms set targets based on traditional measures, such as profit and ROI, without resolving the inconsistency of using NPV for project appraisal and then ignoring it when appraising managers.
APPROACH 2: SHAREHOLDER VALUE ANALYSIS (SVA)
The SVA approach, described by Alfred Rappaport, is a variation of the DCF methodology in that it values the whole enterprise, not just individual projects. Central to the approach are seven ‘value drivers’:
- sales growth
- operating profit margin
- (cash) tax rate
- incremental working capital investment (IWCI)
- fixed capital investment to support current activity levels
(replacement fixed capital investment – RFCI), and to support future growth - (incremental fixed capital investment – IFCI)
- cost of capital
- ‘competitive advantage period’ or ‘value growth duration’ during which the firm is expected to generate superior returns in excess of its cost of capital.
The SVA method involves the following steps:
- Estimate the free cash flows within the competitive advantage period by reference to the value drivers.
- Discount these cash flows, using either a company-wide weighted average cost of capital (WACC) or separate business unit discount rates.
- Add to the result the present value of the firm at the end of the forecast period. This is known as the ‘residual value’, and is usually calculated by discounting simplified cash flows (eg zero or constant growth) beyond the competitive advantage period.
- Add the market value of non-trade or non-operational assets to the result to get the corporate value that belongs to all investors.
- The value of equity is then determined by deducting the value of debt.
EXAMPLE 1
You have been asked to value a potential acquisition. The following information regarding the target is available:
- current sales – $10m pa
- competitive advantage period – five years
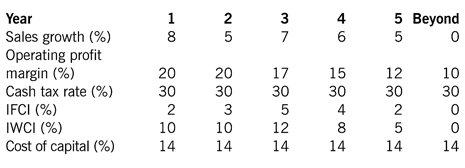
- value driver information:

- depreciation – $5m pa
- market value of short-term investments is $10m
- market value of debt is $15m
- opening capital $3m
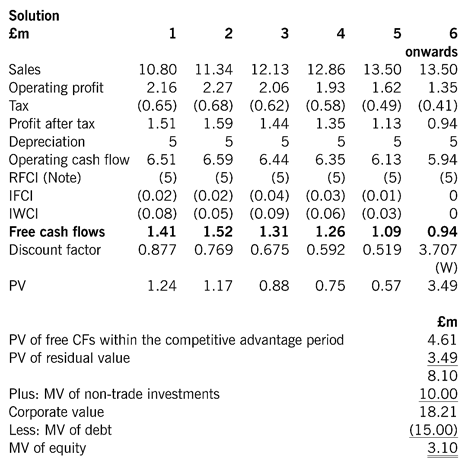
Value the business using SVA.
Note: IFCI and IWCI are given as percentages of the movement in sales from one period to the next.

(W) DF = 0.519 x 1/0.14 = 3.707
Note: without further details, RFCI is often equated to the annual depreciation charge.
Being, in essence, an NPV approach, SVA satisfies our requirements for a long-term value metric. It is thus widely used both by managers, and by potential investors seeking to discover undervalued companies. The seven value drivers can also be used for target setting and for assessing managerial performance in the shorter term. Managers are comfortable with concepts such as sales growth and margin, making the approach popular. The main problem, however, is that there are seven targets, not one, and these may be in conflict. For example, high growth may involve riskier strategies, which in turn will increase the cost of capital and require greater working capital investment.
APPROACH 3: ECONOMIC VALUE ADDED (EVA)
The economic value added (EVA) approach is primarily a performance metric rather than a wealth metric. Stern Stewart & Co, the management consultancy that has trademarked EVA and is credited with popularising the concept, describes EVA as ‘a simple financial measure of performance’.
EVA is the residual income that remains after net operating profit after tax (NOPAT) has been reduced by an additional charge; this charge is based on the return investors can be expected to require, given the amount of capital they have tied up in the business. Note that interest charges are not deducted to arrive at NOPAT, as financing costs are incorporated into the capital charge. Therefore we have:
EVA = NOPAT minus a capital charge
= NOPAT minus (capital x cost of capital)
It is therefore very clear if profits are sufficient to cover the cost of capital. This link can be made more explicit by rewriting EVA, using the ‘spread method’ as:
EVA = (ROI - cost of capital) x capital, where ROI = NOPAT/capital
EXAMPLE 2
Using the same information as in Example 1, calculate the EVA for each year.
Solution
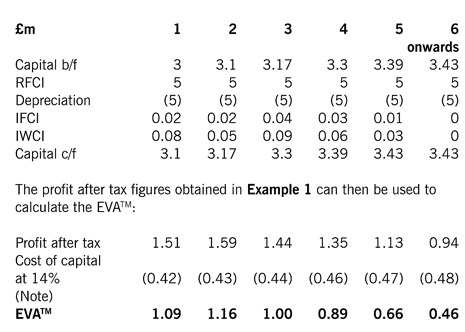
In this example, a more complex calculation must be made to obtain the capital figure as depreciation must be deducted from the running total, and any further investment (IWCI, RFCI, IFCI) added:

Note: cost of capital has been calculated using the capital b/f figures.
Making the full cost of capital so visible to managers should result in their being more careful when choosing to invest further funds, and exercising greater control over working capital investment.
Proponents of EVA argue that it also supports the NPV approach to investment appraisal. To see this, the present value of future EVA figures can be calculated, giving the market value added (MVA) to the business. To calculate the value of equity, this needs to be added to the opening capital and then adjustments made for non-trade assets and debt, as for SVA.
EXAMPLE 3
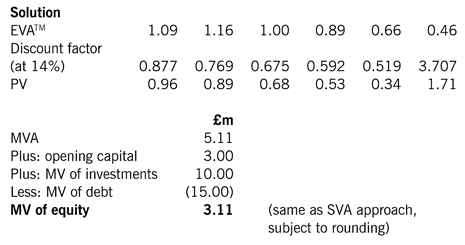
Using the EVA figures calculated in Example 2, calculate the market value of equity for the acquisition.

The result, often a surprise to students, demonstrates that MVA (and hence EVA) should give a strong correlation with shareholder value in the same way as NPV and SVA. Stern Stewart & Co argue that managers can be assessed on EVA with confidence that their actions should lead to wealth creation.
While the focus on a single performance measure is seen to be a major advantage by many, the complexity of the calculations has deterred some, who argue that it is hard for managers to see how their behaviour has affected the EVA .
The main problem with EVA, however, is the danger that managers with a short-term horizon will reject activities that have negative EVA in the first year, even though these activities will deliver positive MVA over the longer term. The adjustments to capital described below, such as capitalising research expenditure, should reduce such behaviour but cannot not eliminate it completely.
ISN’T EVA JUST RI REPACKAGED?
The EVA approach is very similar to the traditional method of calculating residual income (RI). The differences lie in how the component figures (NOPAT, capital, and cost of capital) are calculated. Stern Stewart & Co identified 164 performance measurement issues in its calculation of EVA from published accounts. The adjustments mainly involve:
- converting accounting profit to cash flow
- distinguishing between operating cash flows and investment cash flows.
The most common adjustments include:
- replacing conventional depreciation with an estimate of the ‘economic depreciation’. Economic depreciation measures the true fall in the value of assets each year through wear and tear and obsolescence. Although depreciation would not normally be charged in calculating discounted cash flow, in this case economic depression must be recovered from a company’s cash flow
- reversing out advertising costs from NOPAT and adding them to the capital figure instead. This is because advertising is seen as a market-building investment. A small charge for advertising may remain in the profit and loss account to reflect the economic depreciation of the capitalised value
- in a similar way, research and development costs may be transferred from being expenses to becoming part of capital
- adjusting the tax charge to exclude the tax relief on interest payments made.
APPROACH 4: CASH FLOW RETURN ON INVESTMENT (CFROI)
Cash flow return on investment (CFROI) is the product of Boston Consulting Group (BCG) and HOLT Value Associates.
CFROI is the long-term internal rate of return of the firm, defined in a similar way to the more familiar IRR. This method has the following steps:
- Convert profitability data into inflation-adjusted gross cash flows available to all capital owners in the firm. The approach works with real cash flows rather than nominal flows, hence the need for inflation adjustments.
- Calculate the implied investment based on real gross assets, again inflation-adjusted where necessary. Intangibles, such as goodwill, are normally excluded here.
- Estimate the finite economic life of depreciating assets and the residual value of non-depreciating assets, such as land and working capital.
- BCG then calculates CFROI as the internal rate of return that equates the present value of future cash flows with the estimate of the current value of gross investment.
BCG’s 1993 brochure mentions that the SVA approach was ‘developed especially for corporate planning and related applications’, in contrast to their model which was ‘designed as a tool to assist the institutional investor in picking stocks’.
The process of calculating corporate value in order to identify under-performing shares using CFROI is beyond the scope of both this article and the Paper P4 syllabus. In simple terms, this is done by calculating a countrywide CFROI figure and then using it to discount individual company cash flows. The main weakness lies in measuring managerial performance. Other criticisms include the following:
- The fact that residual value of non-depreciating assets is included as a cash flow, when this would only normally occur under liquidation.
- That countrywide methodology neglects the role of systematic risk in decision making.
- That the calculations are too complicated for most managers.
CONCLUSIONS
Shareholder value is a constant priority in many boardrooms. The need for a wealth metric and a performance metric has generated a range of solutions, but with mixed success. Ultimately, users choose the method best suited to their situation. CFROI is growing in use by potential investors, SVA is often chosen for corporate planning decisions, but EVA appears to offer the simplest and most consistent overall solution.
Steve Weaver is a freelance author


